Cart is empty


Donna Lange
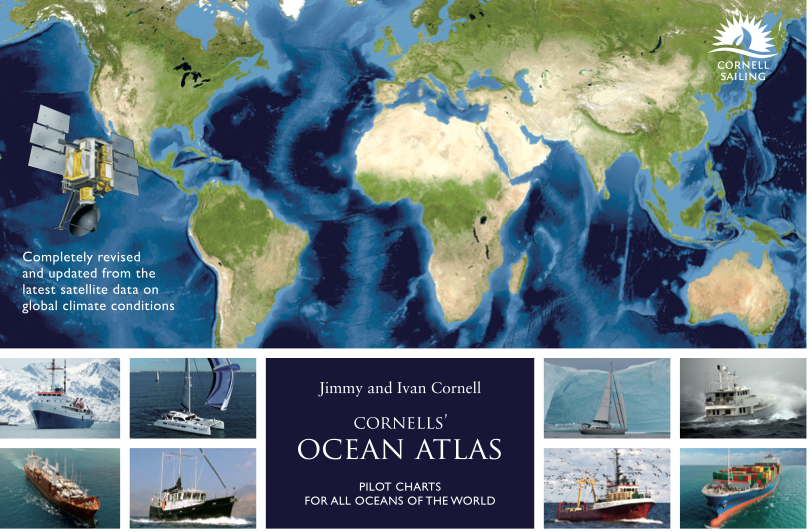


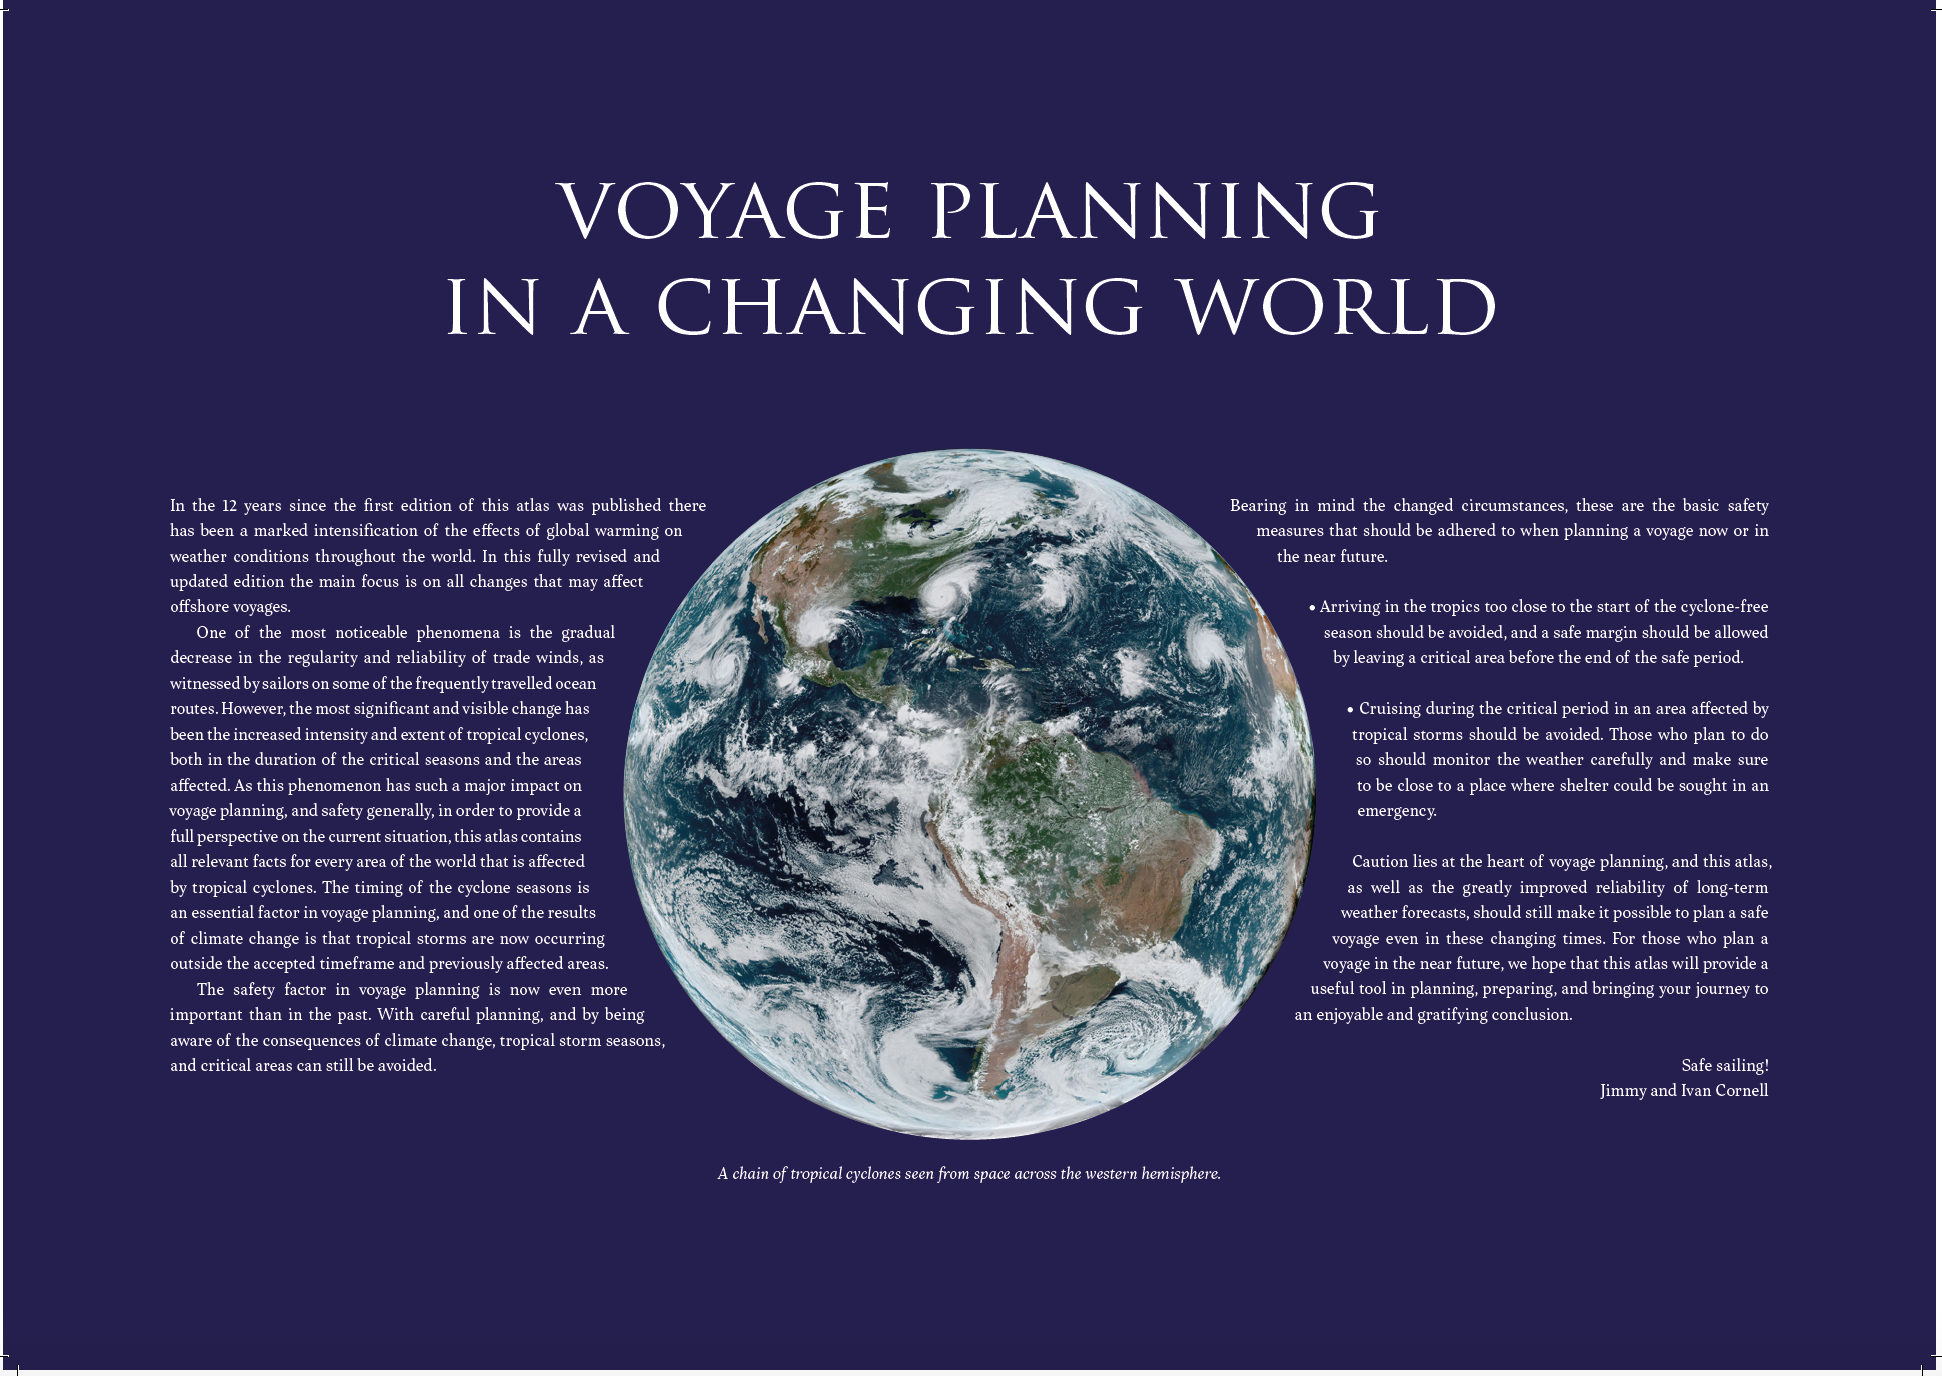
Jimmy Cornell, experienced sailor and bestselling author, has teamed up with his son Ivan to produce a third edition of Cornells’ Ocean Atlas aimed at navigators planning an offshore voyage.
-
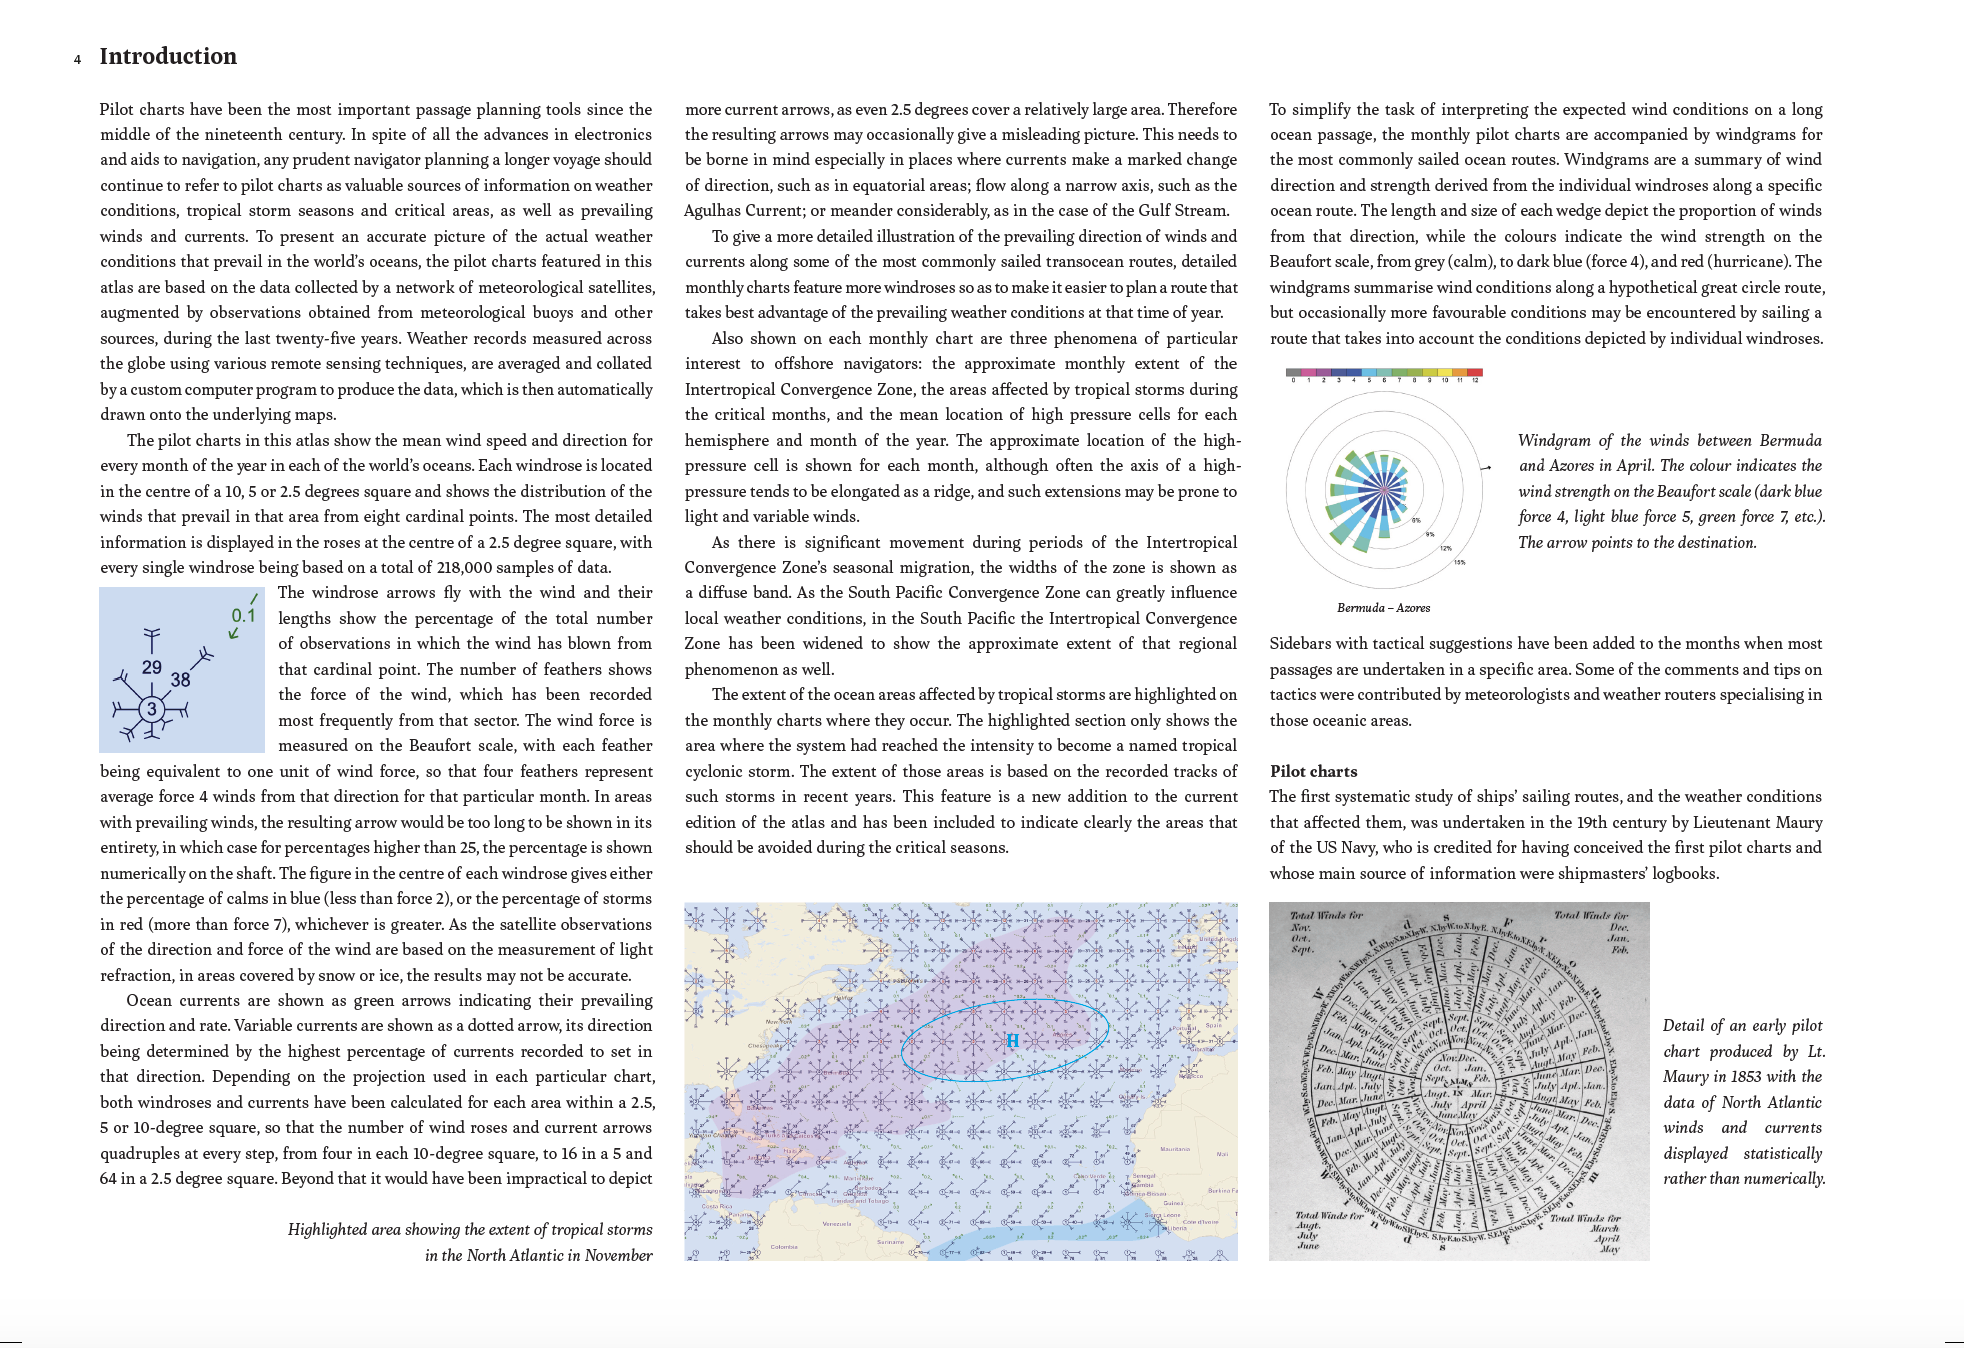
Pilot charts have been the most important passage planning tools since the middle of the nineteenth century. In spite of all the advances in electronics and aids to navigation, any prudent navigator planning a longer voyage should continue to refer to pilot charts as valuable sources of information on weather conditions, tropical storm seasons and critical areas, as well as prevailing winds and currents.
In the 12 years since the first edition of this atlas was published there has been a marked intensification of the effects of global warming on weather conditions throughout the world. In this fully revised and updated edition the main focus is on all changes that may affect offshore voyages.
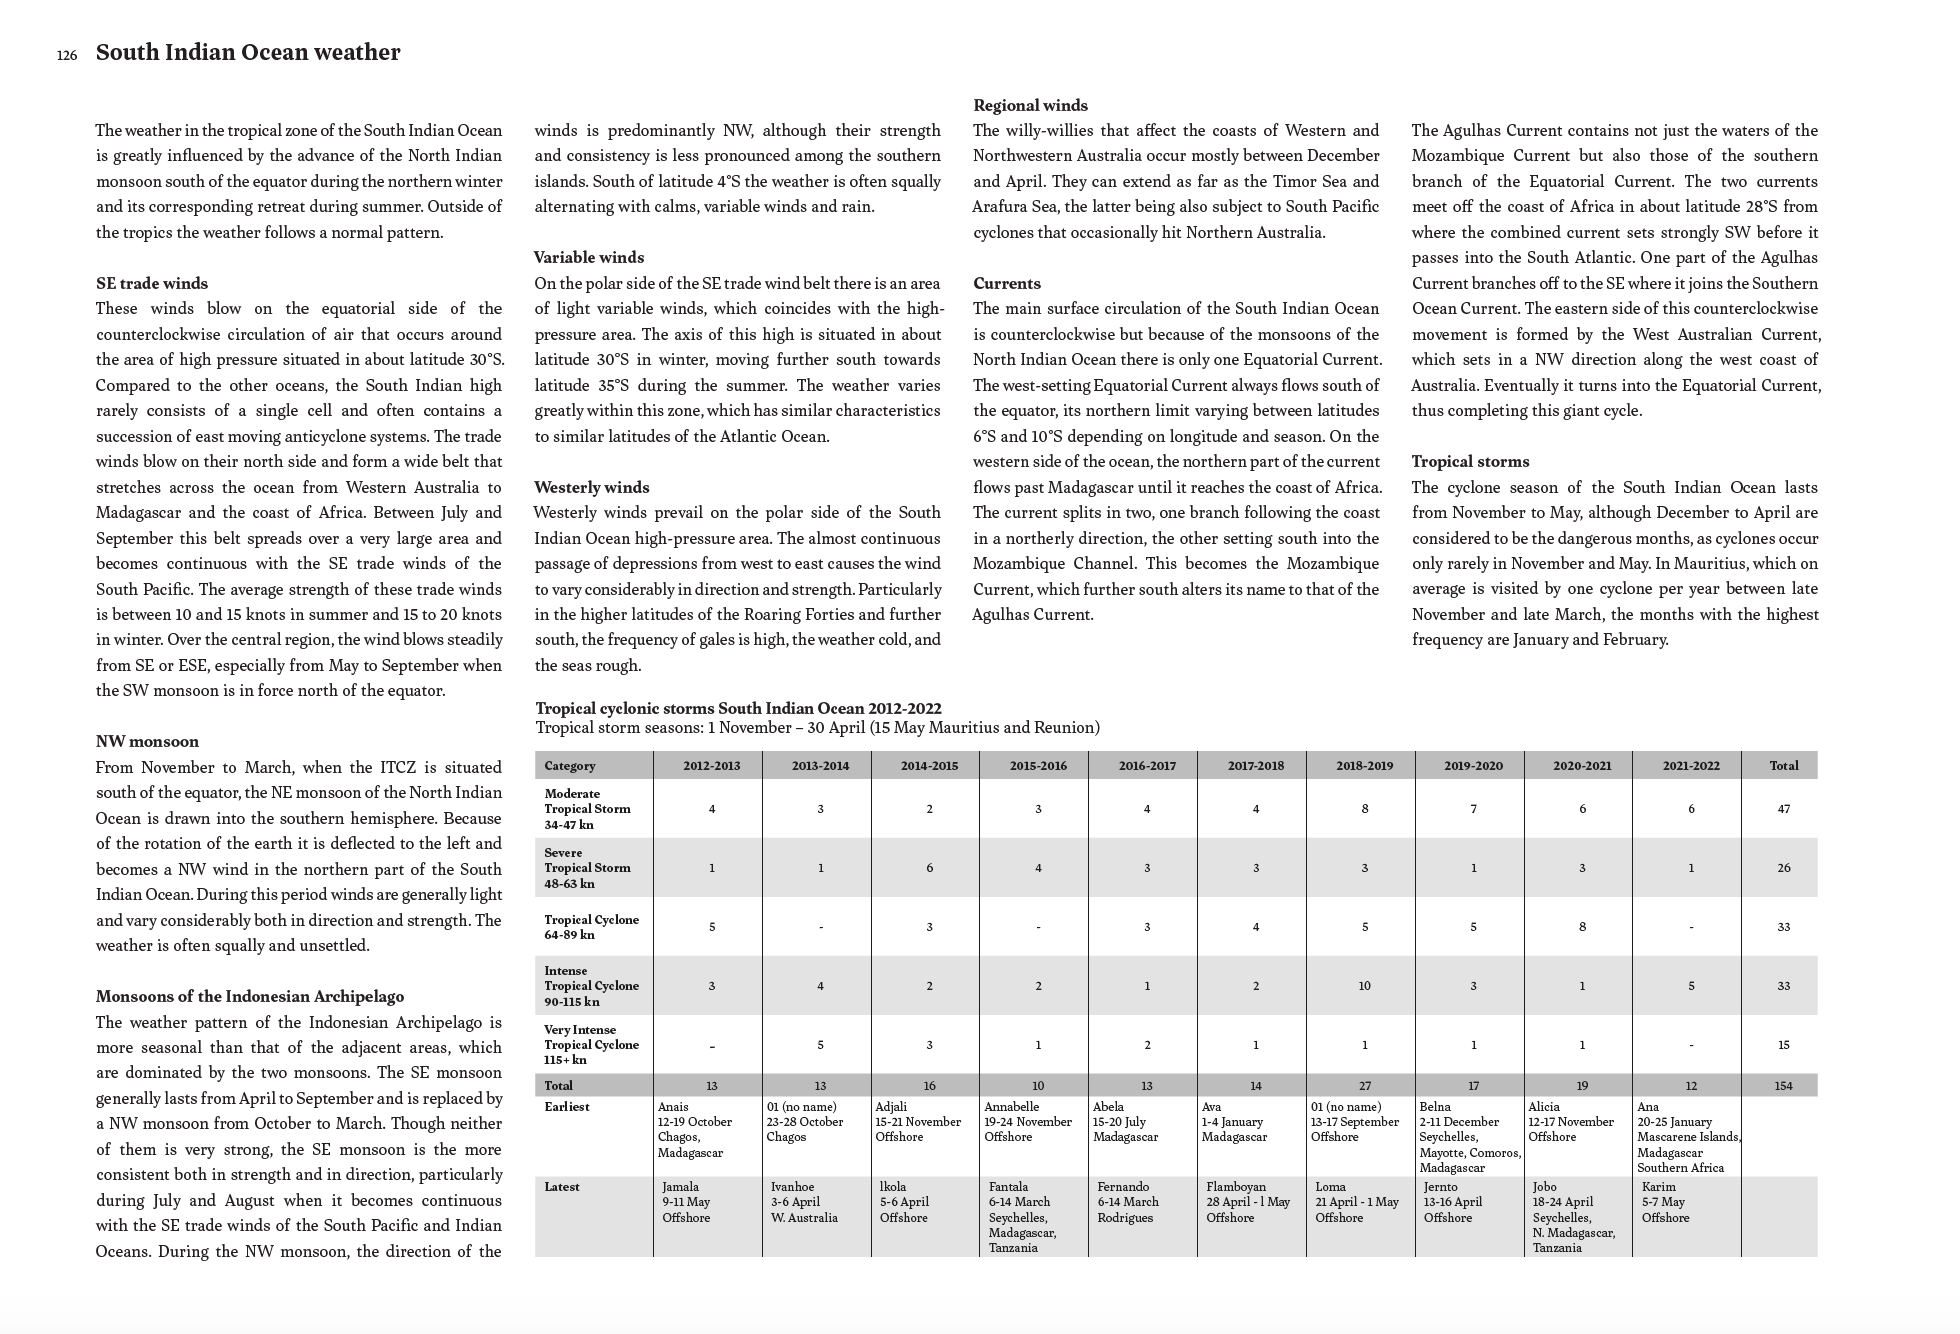
One of the most noticeable phenomenon is the decrease in the regularity and reliability of trade winds, as witnessed by sailors on some of the frequently travelled ocean routes. However, the most significant and visible change has been the increased intensity and extent of tropical cyclones, both in the duration of the critical seasons and the areas affected. As this phenomenon has such a major impact on voyage planning, and safety generally, in order to provide a full perspective on the current situation, this new edition contains all relevant facts for every area of the world that is affected by tropical cyclones.
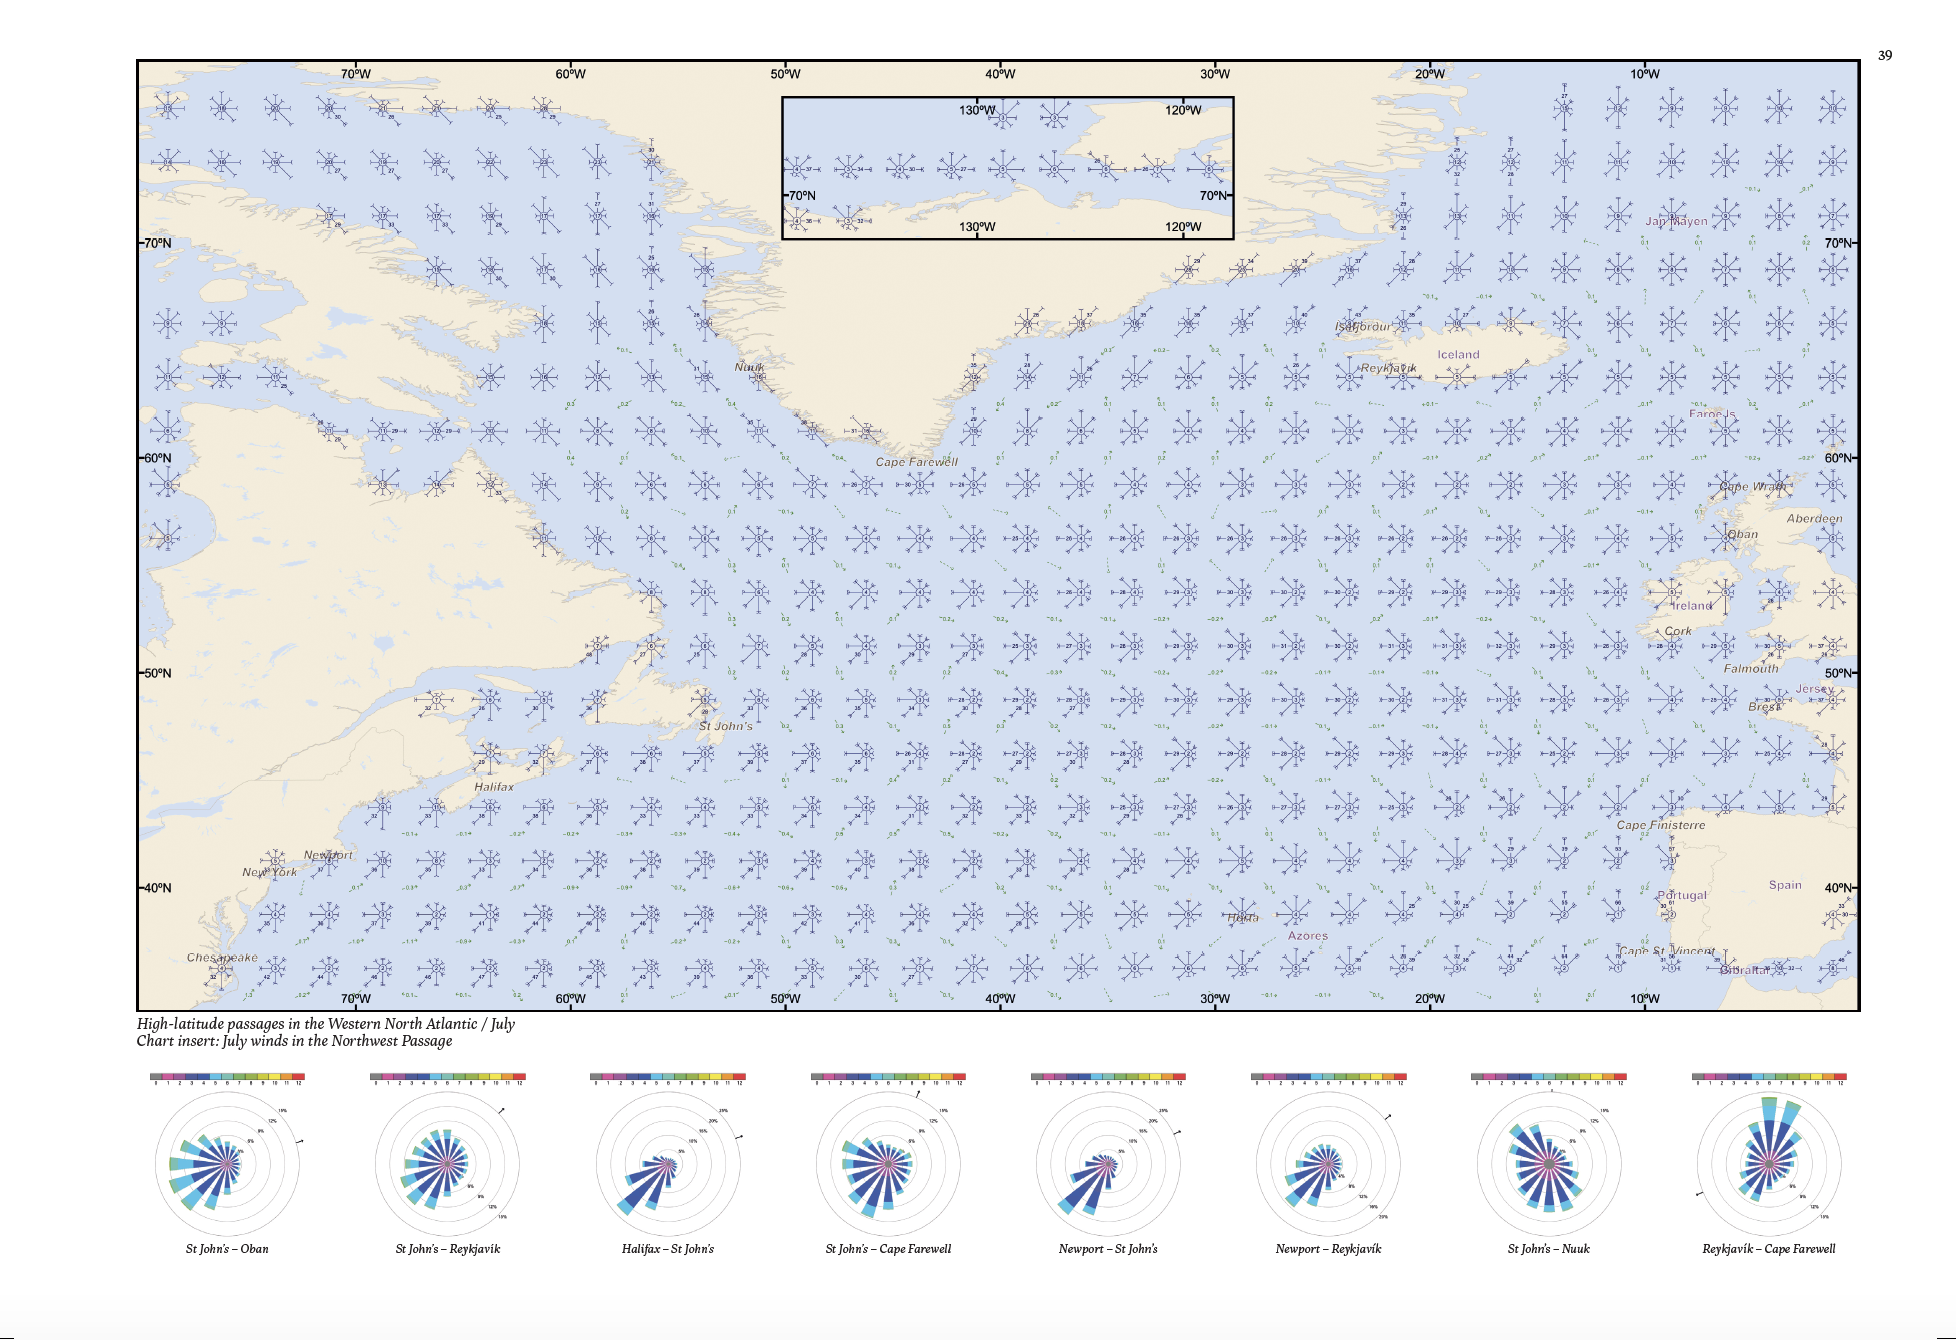
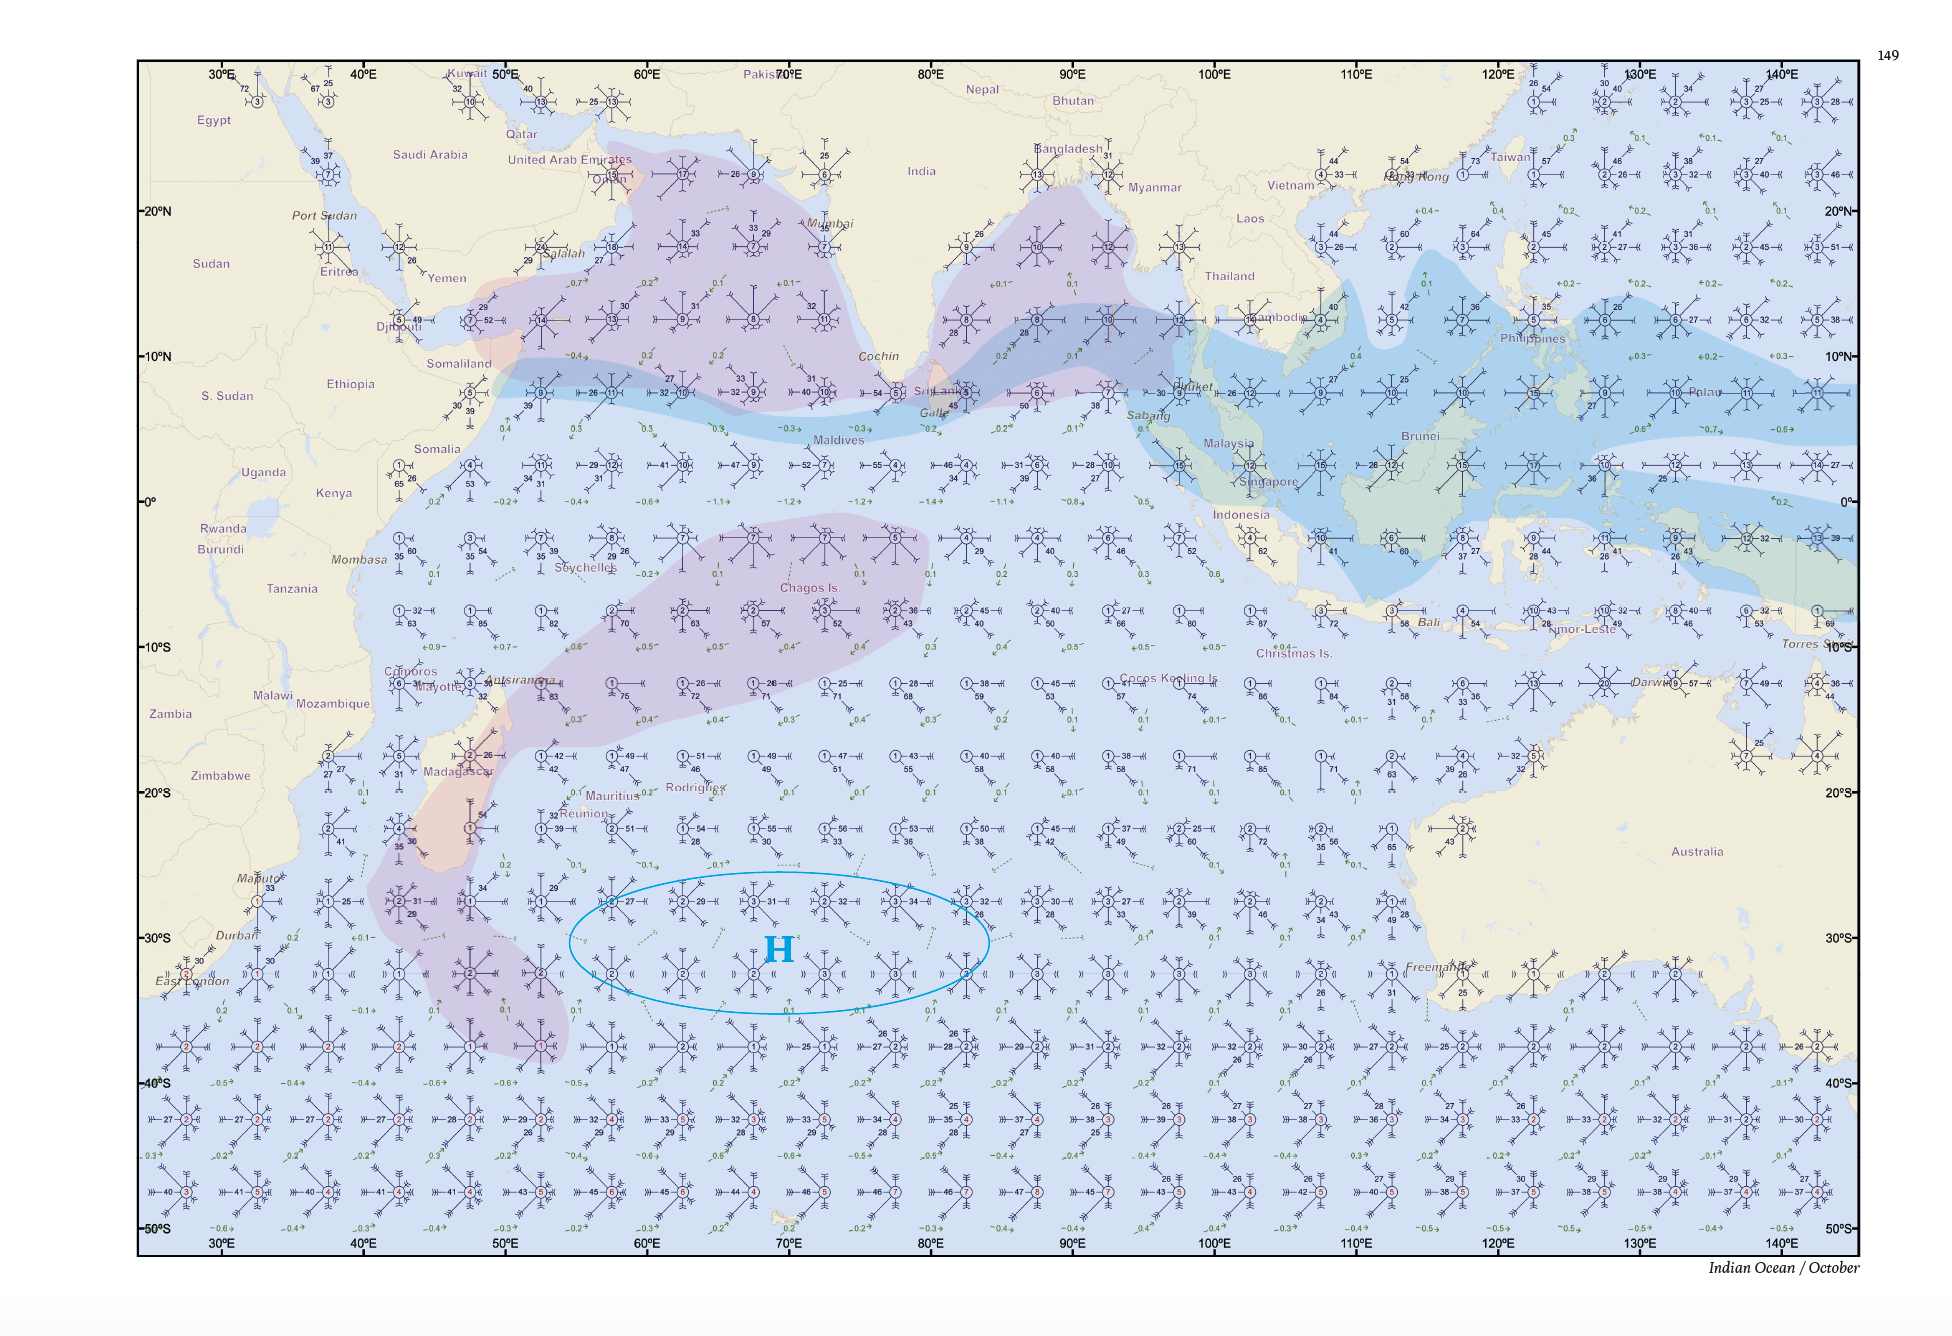
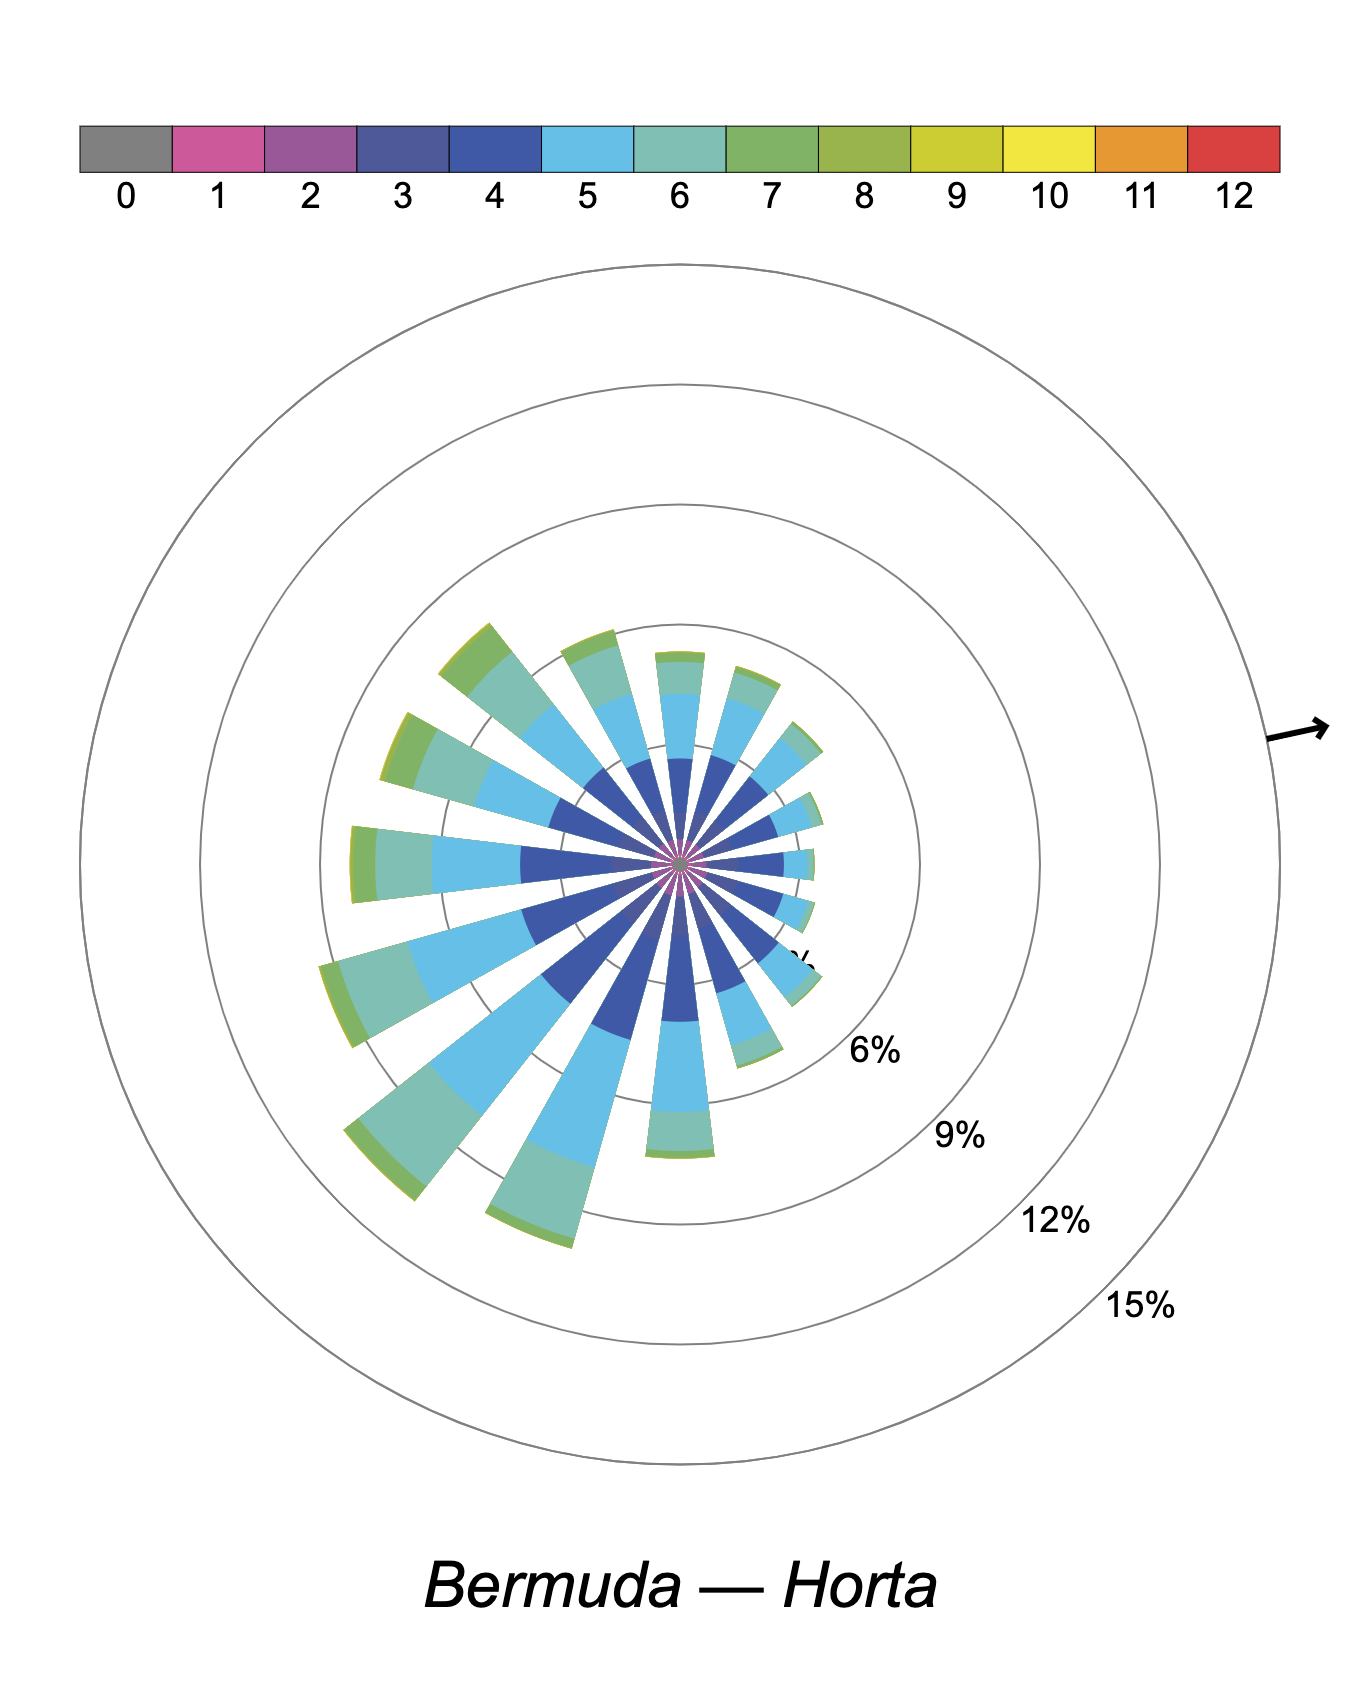
To present an accurate picture of the actual weather conditions that prevail in the world’s oceans, the pilot charts featured in this atlas are based on the data collected by a network of meteorological satellites, augmented by observations obtained from meteorological buoys and other sources, during the last twenty-five years. The most detailed information is displayed in windroses, with every single windrose being based on a total of 218,000 samples of data.
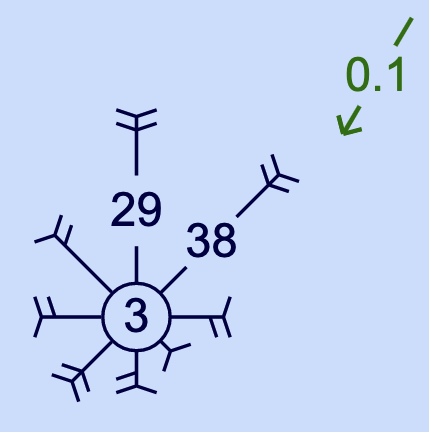
The windrose arrows fly with the wind and the length of each arrow shows the percentage of the total number of observations in which the wind has blown from that cardinal point. The number of feathers shows the force of the wind, which has been recorded most frequently from that sector. The wind force is measured on the Beaufort scale, with each feather being equivalent to one unit of wind force, so that four feathers represent average force 4 winds from that direction for that month. In areas with prevailing winds, the resulting arrow would be too long to be shown in its entirety, in which case for percentages higher than 25, the percentage is shown numerically on the shaft. The figure in the centre of each windrose gives either the percentage of calms in blue (less than force 2), or the percentage of storms in red (more than force 7), whichever is greater.
Ocean currents are shown as green arrows indicating their prevailing direction and rate in knots. Variable currents are shown as a dotted arrow, its direction being determined by the highest percentage of currents recorded to set in that direction.
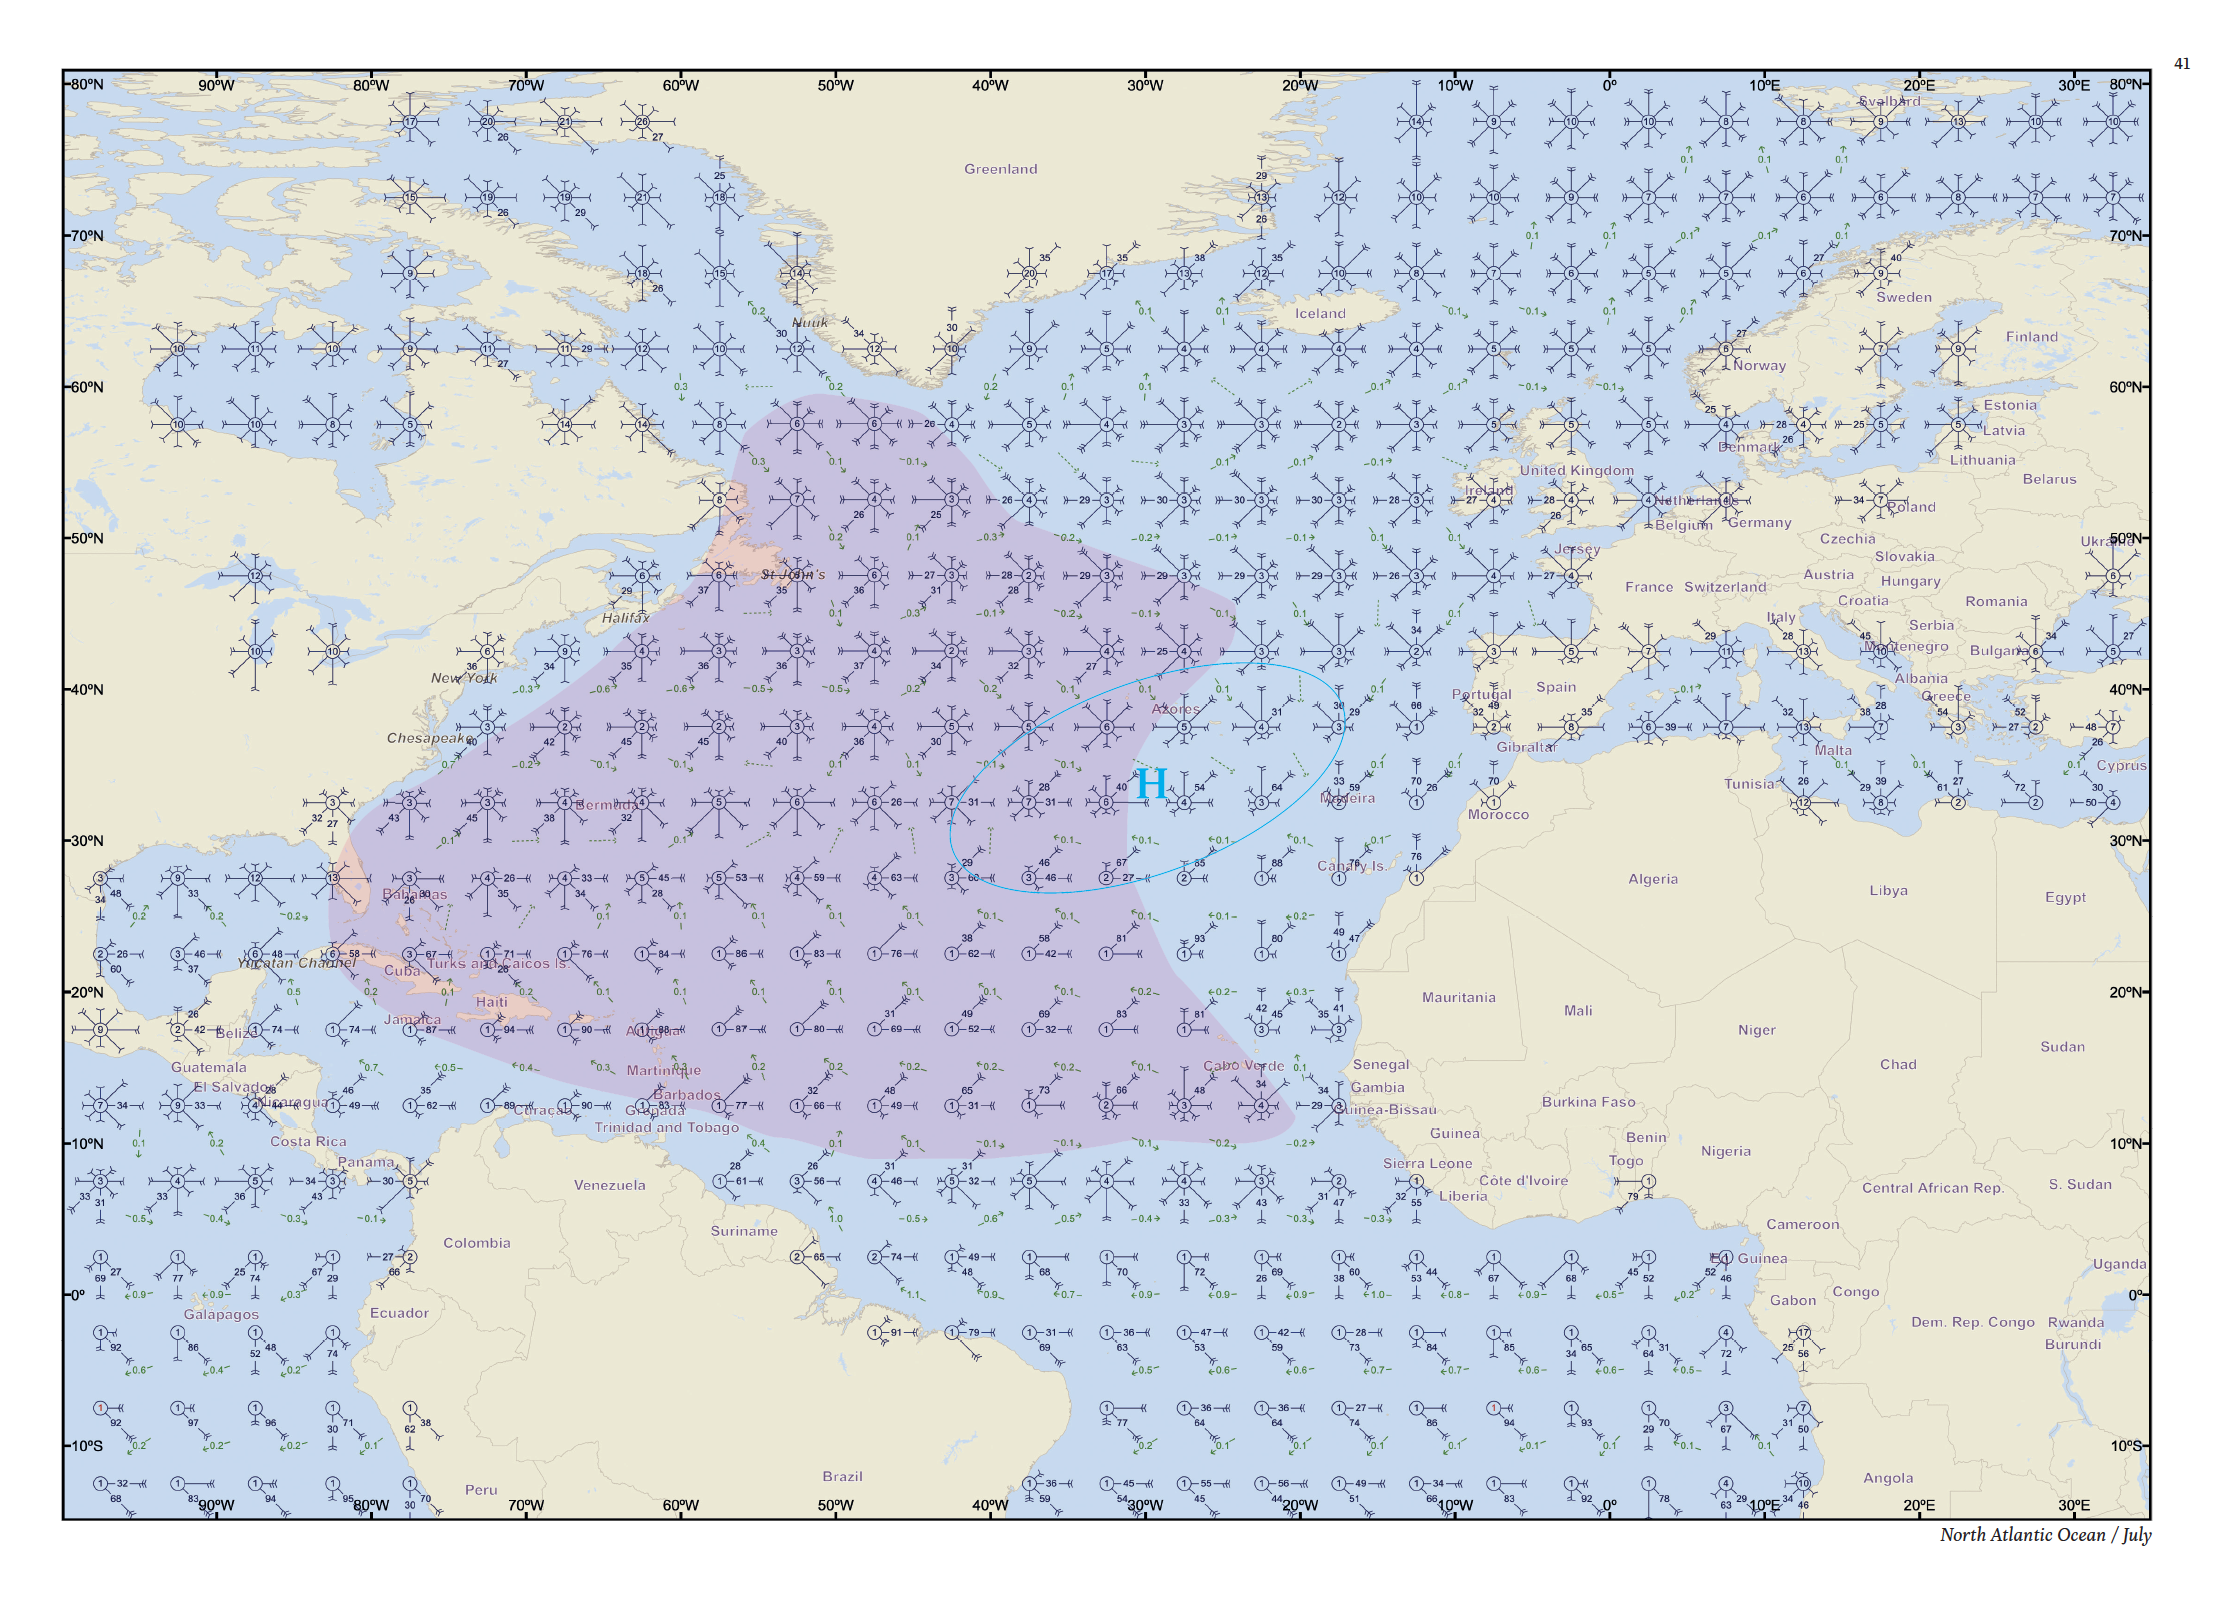
Hurricane area North Atlantic July
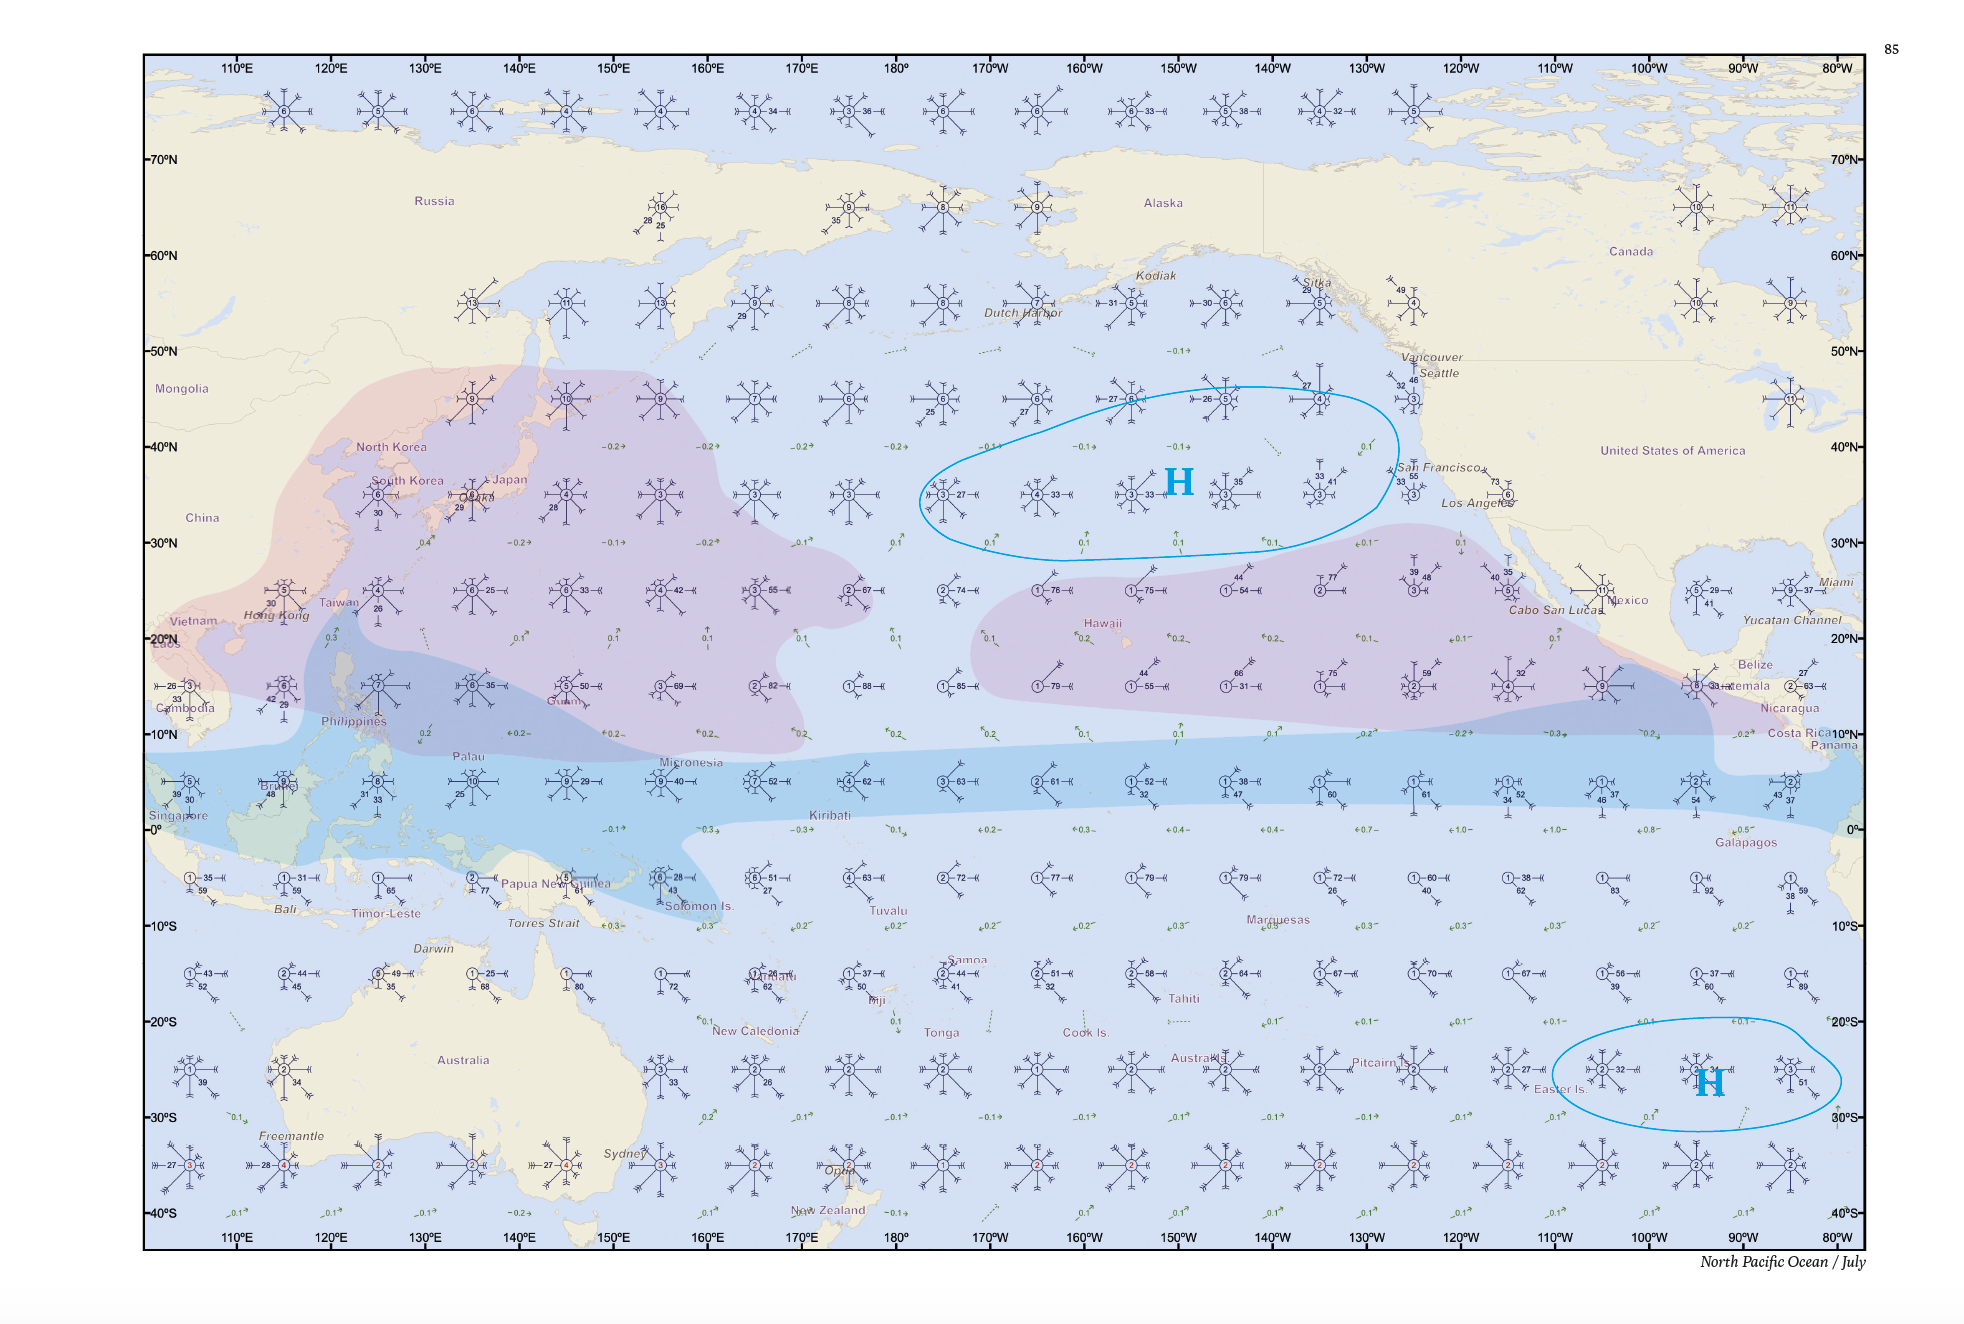
The extent of the ocean areas affected by tropical storms are highlighted on the monthly charts where they occur. The highlighted section only shows the area where the system had reached the intensity of a become a tropical cyclonic storm. The extent of those areas is based on the recorded tracks of such storms in recent years. This feature is a new addition to the current edition of the atlas and has been included to indicate clearly the areas that should be avoided during the critical seasons.

Cyclones areas North Pacific July
Also shown on each monthly chart are three phenomena of particular interest to offshore navigators: the approximate monthly extent of the Intertropical Convergence Zone, the areas affected by tropical storms during the critical months, and the mean location of high-pressure cells for each hemisphere and month of the year. The approximate location of the high-pressure cell is shown for each month.
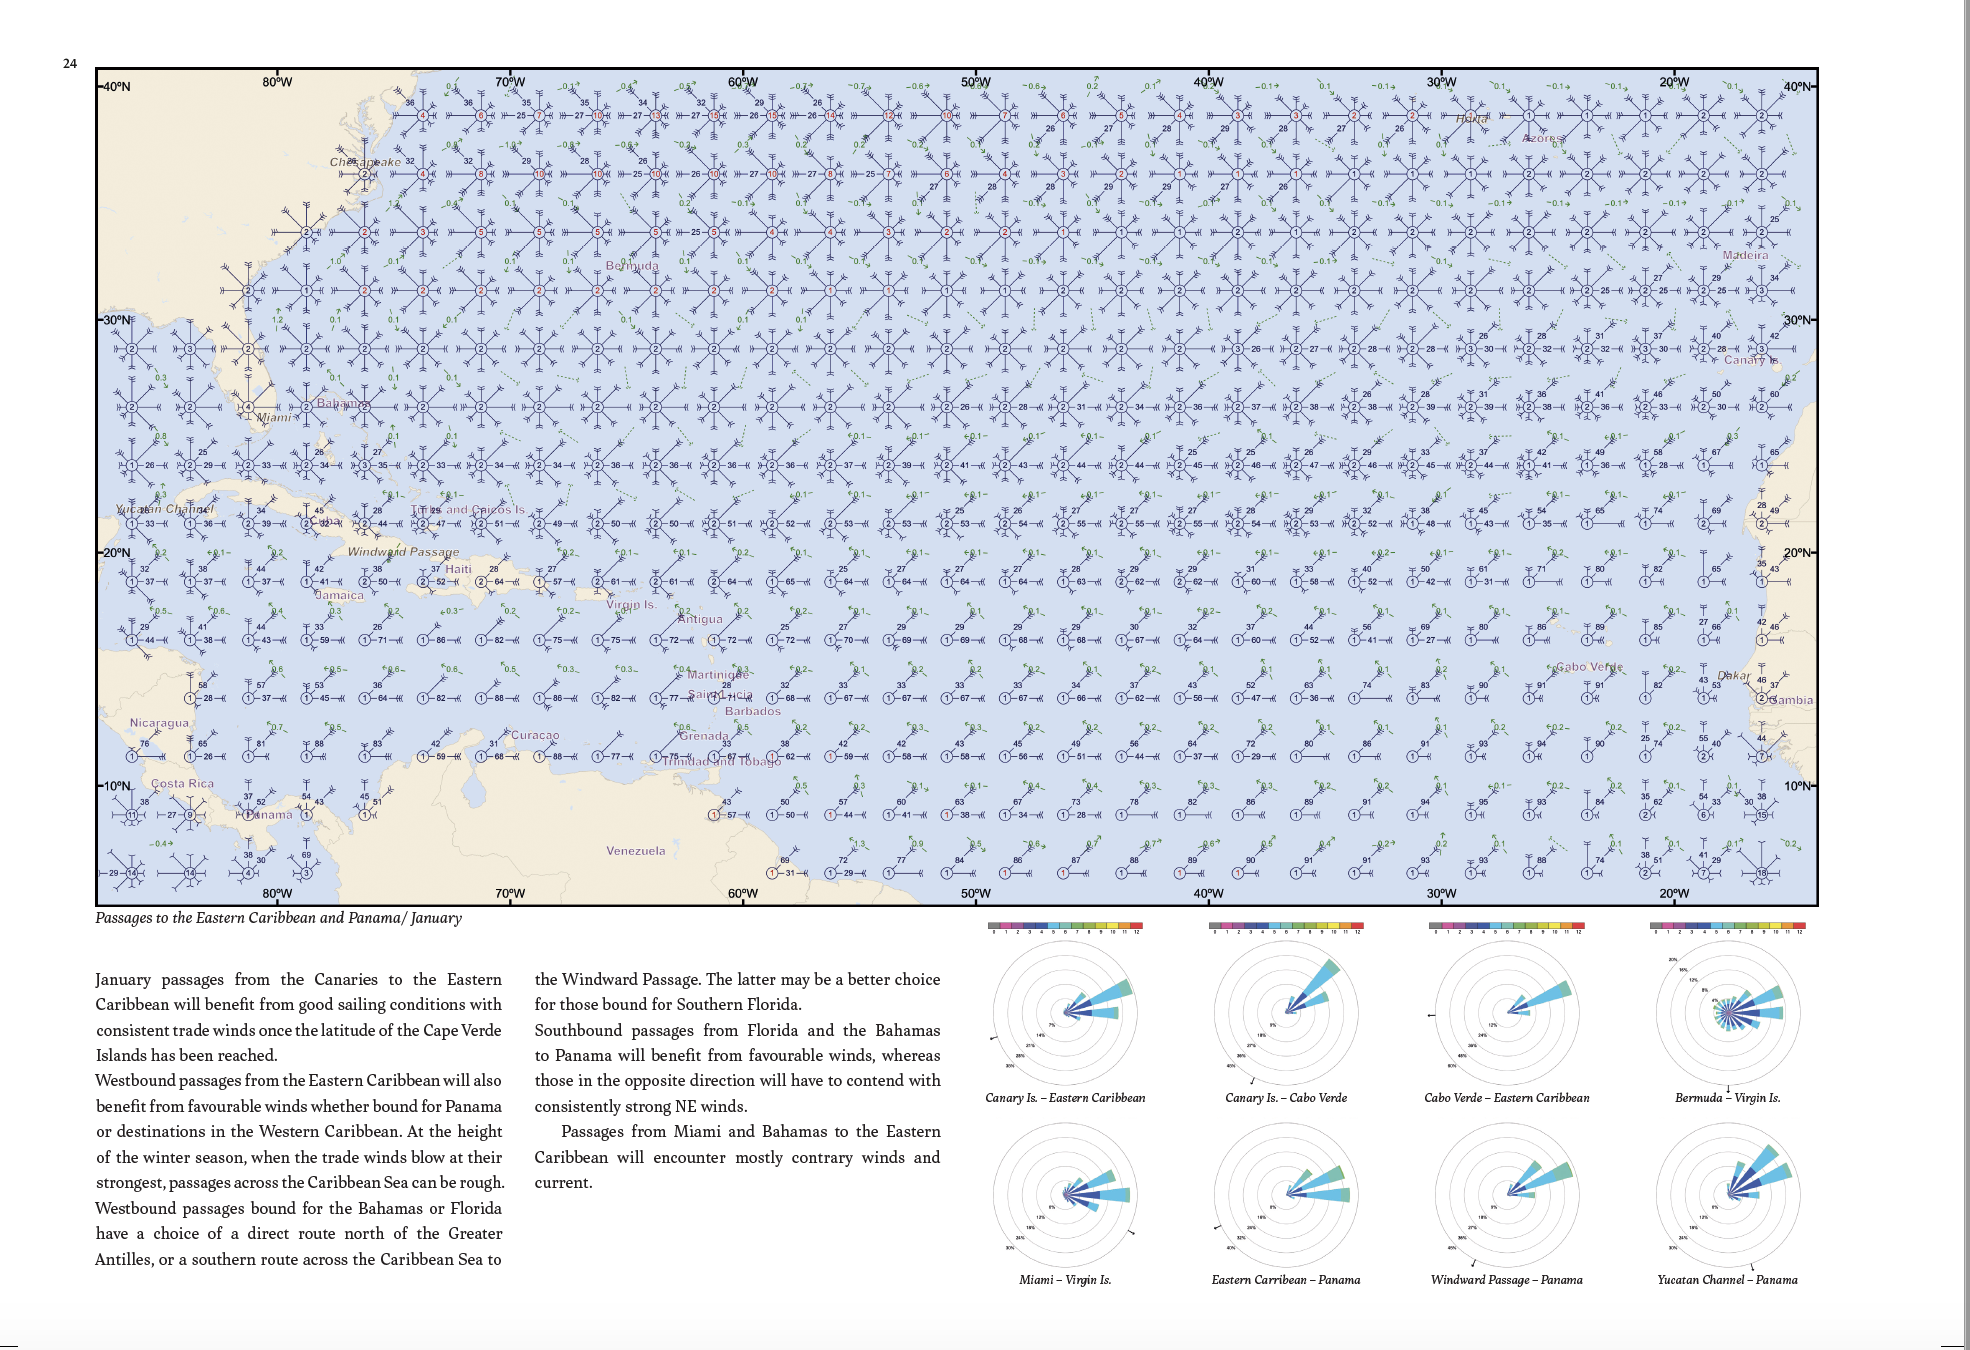
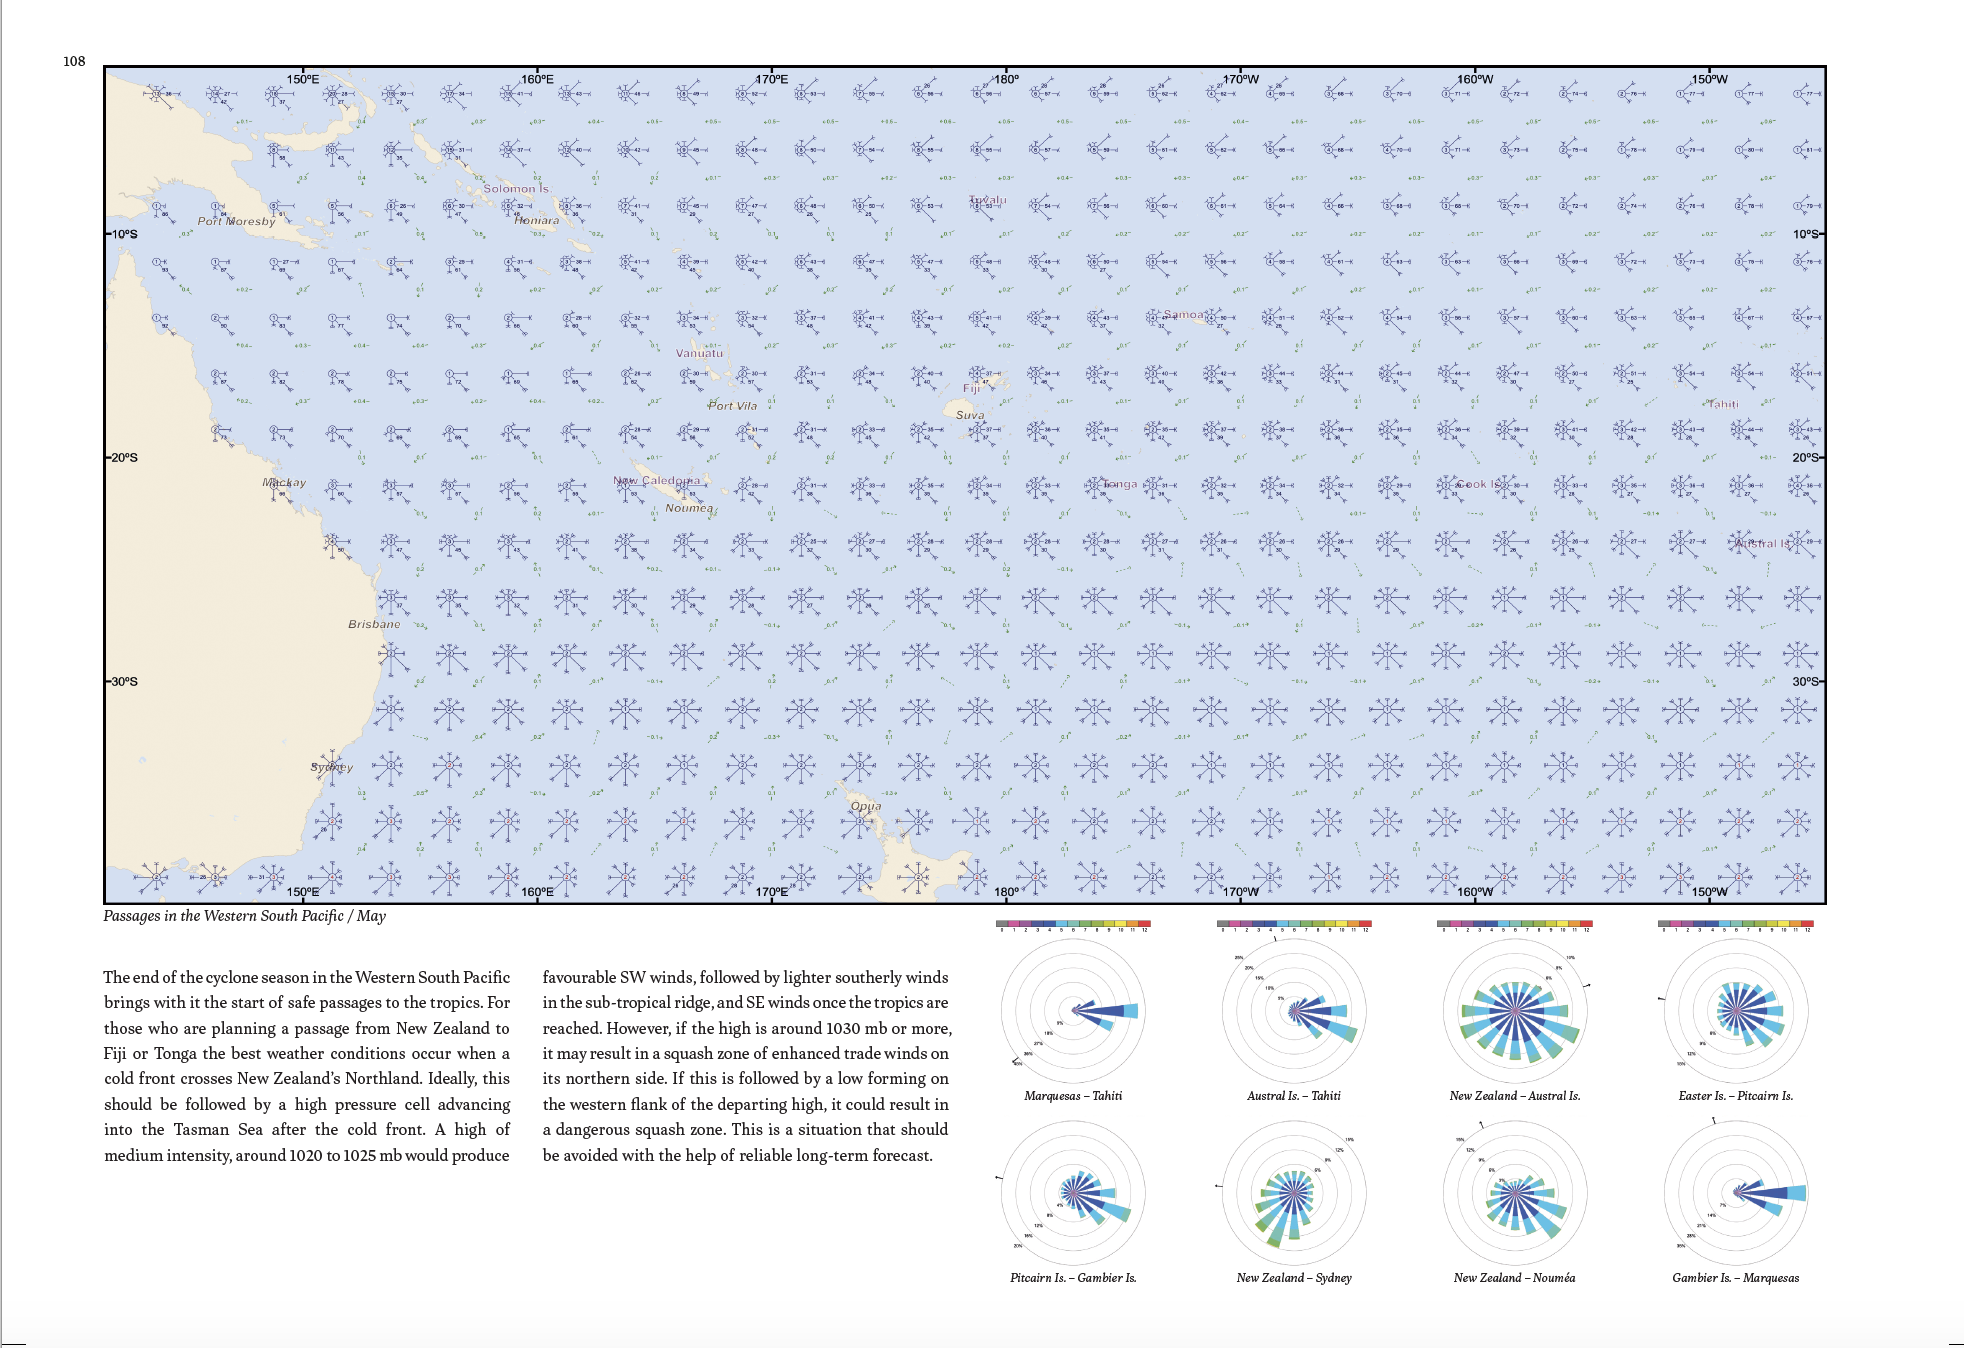
Sidebars with tactical suggestions have been added to the months when most passages are undertaken in a specific area. Some of the comments and tips on tactics were contributed by meteorologists and weather routers specialising in those oceanic areas.
The safety factor in voyage planning is now even more important than in the past. With careful planning, and by being aware of the consequences of climate change, tropical storm seasons, and critical areas can still be avoided. Bearing in mind the changed circumstances, these are the basic safety measures that should be adhered to when planning a voyage now or in the near future.
Arriving in the tropics too close to the start of the cyclone-free season should be avoided, and a safe margin should be allowed by leaving a critical area before the end of the safe period.
Caution lies at the heart of voyage planning, and this atlas will make it possible to plan a safe voyage even in these changing times. For those who plan a voyage in the near future, this atlas will provide a useful tool in planning, preparing, and bringing a journey to a safe and happy conclusion.
 Our paper charts are printed on high resolution, heavyweight, water-resistant paper, using state of the art printing technology. The paper and printing process has been certified by NOAA and deemed to be suitable to withstand the rigors of use in the marine environment. FULL SIZED PAPER CHARTS ARE CERTIFIED FOR CARRIAGE ABOARD COMMERCIAL VESSELS |
 Our waterproof charts are printed on a TIP: If you plan to frame or laminate a chart using heat, then do not choose waterproof because the material can melt under heat. FULL SIZED WATERPROOF CHARTS ARE CERTIFIED FOR CARRIAGE ABOARD COMMERCIAL VESSELS |
Size Options |
|
|
|
 These are up-to-date, NOAA charts simply enlarged in size so that the small dimension of the chart is 42”, the long dimension is proportionally enlarged. These charts are printed beyond full size, therefore the scale is not the same as the full size NOAA chart, however the scale bars on the charts are proportionally enlarged in size, and can be used for reference. LARGE FORMAT CHARTS ARE NOT CERTIFIED FOR CARRIAGE ABOARD COMMERCIAL VESSELS |
Other Options |
|
|
|
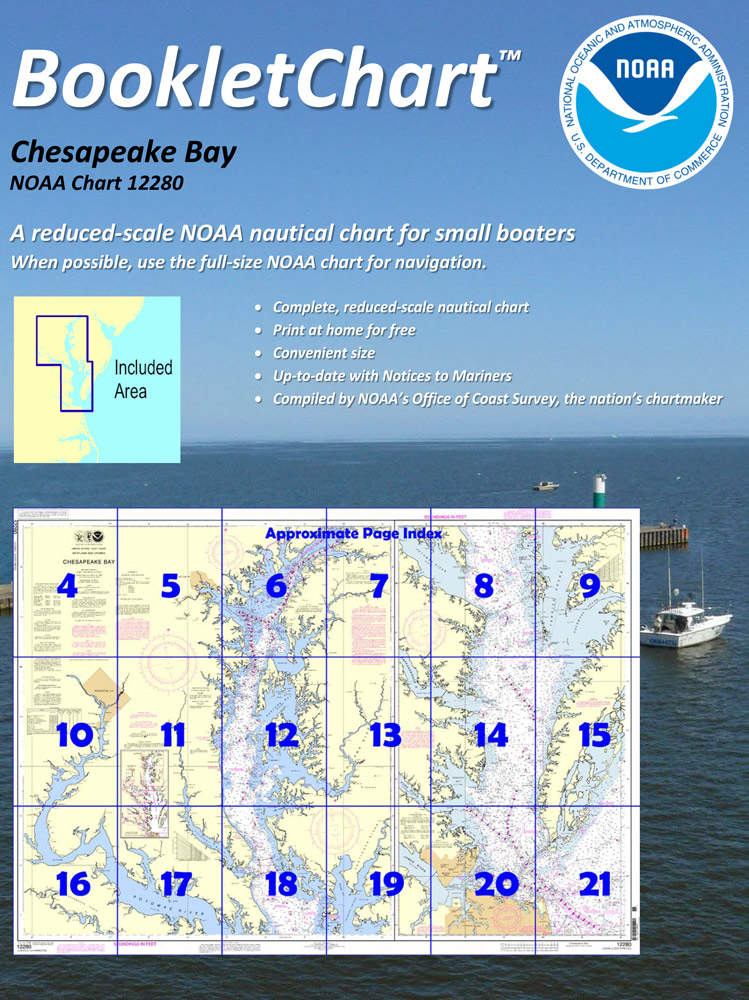
 Made to help recreational boaters locate themselves on the water. It has been reduced in scale for convenience, but otherwise contains all the information of the full-scale nautical chart. The bar scales have also been reduced, and are accurate when used to measure distances in these BookletCharts. • Professionally printed and staple-bound using high quality, durable paper. • Includes Notices to Mariners • Printed on-demand with the latest data from NOAA BOOKLET CHARTS ARE NOT CERTIFIED FOR CARRIAGE ABOARD COMMERCIAL VESSELS |
 |
This is a unique line of decorative charts prepared by Paradise Cay Publications.
The short side of the chart is always printed at 36" and the long side will vary depending on the chart - please do not order framing prior to receiving the chart. These will memorialize your favorite coastal area in vintage style and we have added to the standard border of the typical NOAA chart to allow for a more professional, frame-ready presentation. DECORATIVE CHARTS ARE NOT CERTIFIED FOR CARRIAGE ABOARD COMMERCIAL VESSELS |